| Welcome: |
|
| Lesson 1: |
Part 3: Resistance Lines |
|
Bearish Resistance Line.
Exact opposite of the bullish
support line. It serves as a guide for the downtrend of a stock.
Has a habit of acting like a brick wall. Stocks will often rally
right up to the bearish resistance line and then bounce off.
To draw the resistance line, you must first have a sell signal
from the top. Go to the highest column of X's and begin drawing
a line down at a 45 degree angle or a 135 degree angle.
Once a stock is well below the bearish resistance line, short
term resistance lines can be drawn.
The bearish resistance line must be violated and not just touched
in order to turn the trend positive.
|

|
We typically prefer not to go
long when below the Bearish Resistance Line. This line, like
the Bullish Support Line, can be as strong as a brick wall. We
say a stock is bearish when it is on a sell signal and below
the Bearish Resistance Line. Be wary of buy signals that come
from just below this resistance line as they tend to be false
or best suited to traders. Stocks that are moving up to this
line typically find formidable resistance there. Also, a stock
must be on a buy signal to penetrate the Bearish Resistance Line.
Short sales can be initiated in weak stocks when the underlying
stock rallies up to the resistance line but is still below it.
This is the optimum point to sell short on any of the bearish
chart patterns.
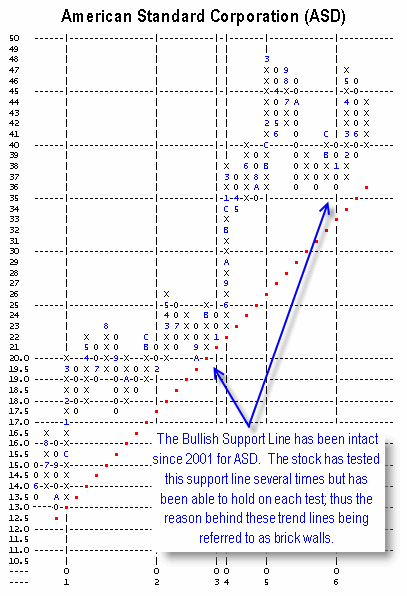
Example of a long term Bullish
Support Line.


Example of a long term Bearish
Resistance Line:

|