Weekly Feature
Published: May 18, 2026
This content is for informational purposes only. This should not be construed as solicitation. The general public should consult their financial advisor for additional information related to investment decisions.
With no changes to any of the Invesco models this week, we look at the Invesco DB Agriculture Fund (DBA).

There are no changes to any of the Invesco models this week. There has not been clear, sustained leadership over the last couple months - the strength of precious metals faded earlier this year and the geopolitical-driven spike in energy prices has not translated into consistent relative strength. However, agricultural futures contracts currently occupy five of the top 10 spots in the continuous commodity matrix, which ranks 19 commodity contracts and one index based on relative strength.

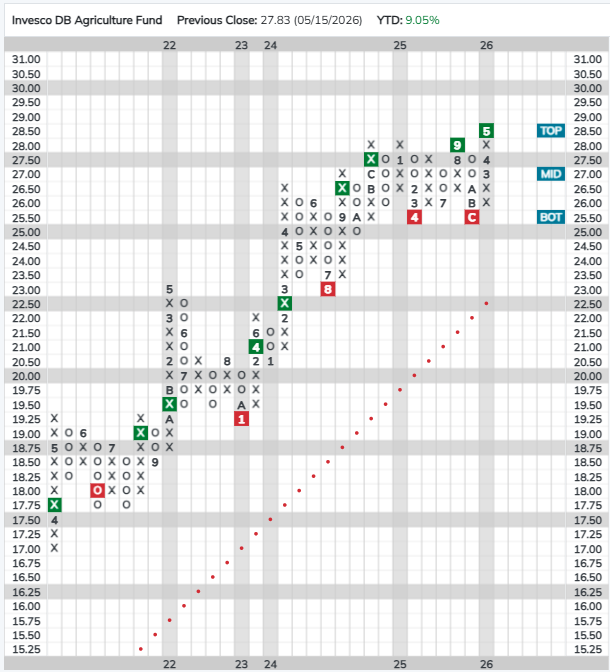
Investors interested in adding exposure to agricultural commodities should consider the Invesco DB Agriculture Fund (DBA). DBA currently as a favorable 3.91 fund score, which is 0.41 points better than the average for all agriculture funds, and a positive 2.39 score direction. On its default chart, DBA returned to a buy signal and reached a new multi-year high last week when it broke a spread quadruple top at $28.50, taking out resistance that has been in place since late 2024.

While DBA currently sits at a multi-year high on its P&F chart, it remains in actionable territory on its 10-week trading band with a weekly overbought/oversold (OBOS) reading of 34%. Initial support is offered at $25.50, a level from which DBA reversed up on two prior occasions. Year-to-date (through 5/15) DBA has gained 9.05% on a price return basis; the fund also carries a 3.5% yield.

Back to report

DISCLOSURE

**Unless otherwise stated, the performance numbers herein are based on price returns and do not include dividends or all transaction costs. Past performance is not indicative of future results. Potential for profits is accompanied by possibility of loss. PowerShares has arranged with Dorsey, Wright to provide this specialized ETF Point & Figure Analysis page on PowerShares sponsored products. The Point & Figure analysis, models and resulting rankings, including any information, data or commentary included herein, are created and provided solely by Dorsey, Wright & Associates. Such analysis, models and rankings should not be considered an offer to purchase or sell, or a solicitation of an offer to buy or purchase any security. The examples presented do not take into consideration commissions, tax implications, or other transactions costs. Neither Dorsey, Wright nor PowerShares through this ETF page provide investment advice or recommendations regarding any security, fund or market. As the investment professional making the final decision with respect to allocations, including any related suitability, fiduciary or other legal obligation, please remember to adhere to all applicable laws, regulations, and rules including NASD Rules 2090 and 2111. The percentage of the portfolio devoted to any ETF is at the sole discretion of the financial advisor or the customer, and not Dorsey, Wright & Associates or PowerShares. If you are not familiar with the Point & Figure methodology, we suggest you read "Point & Figure Charting, 4th Edition" by Thomas J. Dorsey and visit the PnF University, www.dorseywright.com. If you are not familiar with the PowerShares products, or Exchange Traded Funds (ETFs), we suggest you visit www.powershares.com.