Most Requested Symbols

After stalling in Q4 of 2025, Chinese equities are right back on track as the country has shown much improvement so far in 2026. Earlier this year BYD, an EV seller based in China, officially surpassed Tesla as the world’s top EV maker. This represents a significant milestone for the company and adds to a series of achievements for China, underscoring its impressive innovative progress (source: cnbc.com). Additionally, China’s central bank announced that they will cut the reserve requirement ratio and interest rates in 2026 to allow a smooth implementation of any future monetary policy. As mentioned directly from the China’s central bank’s website, “make flexible and efficient use of multiple monetary policy tools such as reserve requirement ratio cuts and interest‑rate cuts, maintain ample liquidity, keep overall financing conditions relatively accommodative, and guide reasonable growth in total credit as well as balanced loan issuance" (source: reuters.com). This could provide a possible tailwind as Chinese equities begin 2026.
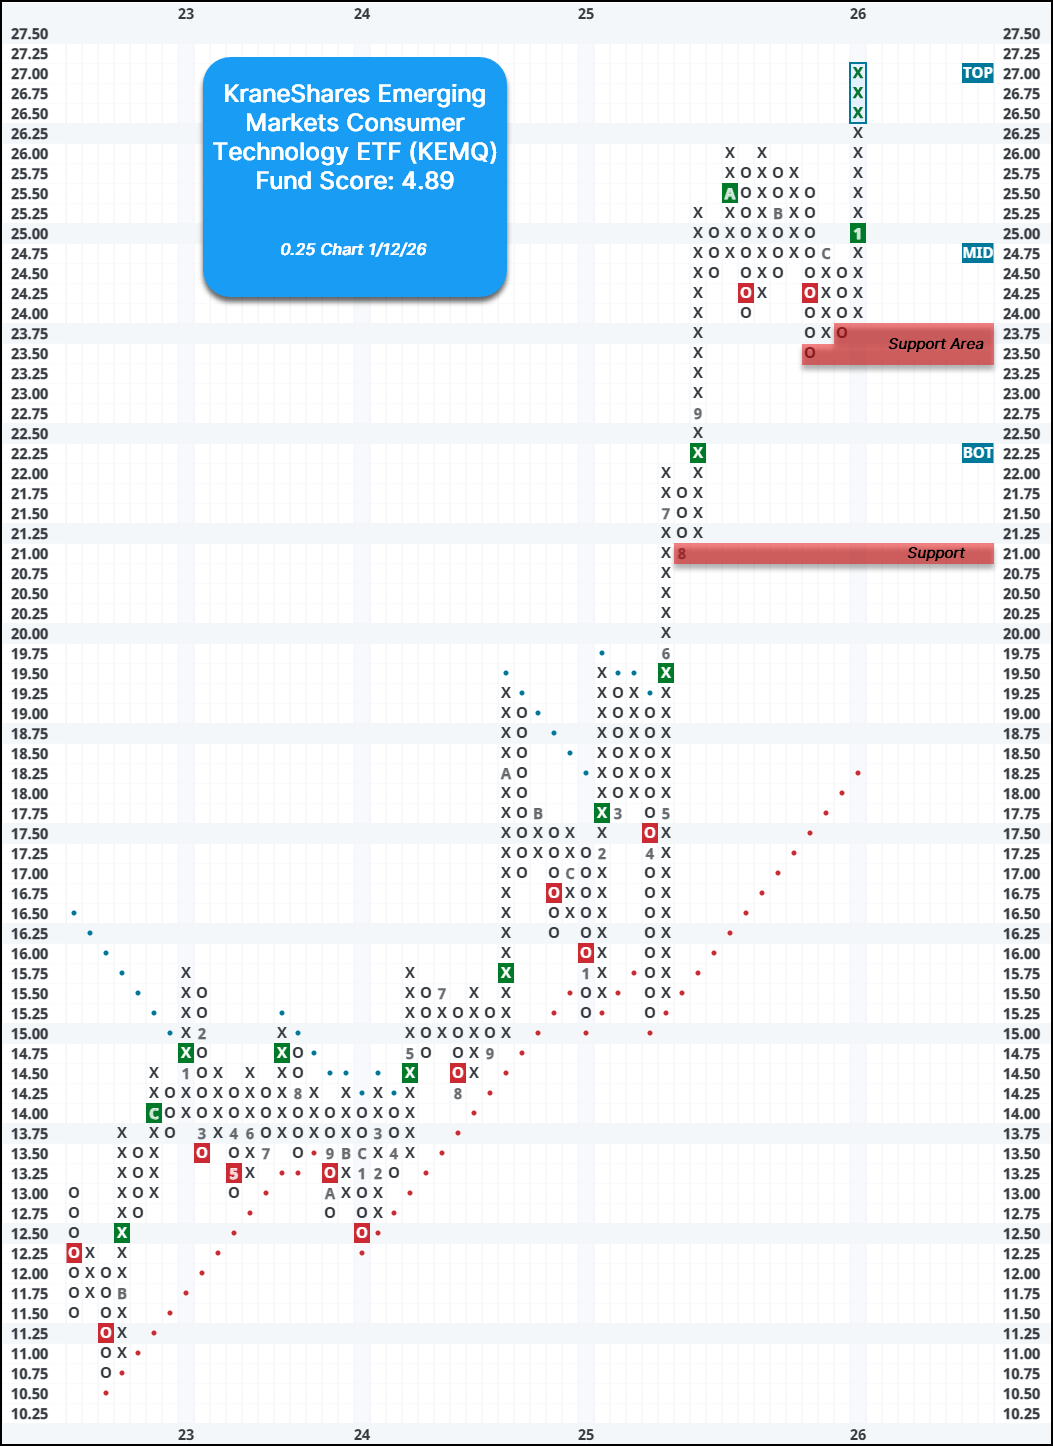
The Krane Shares Emerging Markets Consumer Technology Index ETF (KEMQ) provides exposure to emerging technologies in China. When looking at the fund on a 0.25 scale, you can see that it gave a buy signal earlier this year at $25. The fund sits at multi-year highs around $27 and was up over 56% in 2025. Year-to-date, the fund is up over 9%. KEMQ maintains a strong fund score of 4.89. Additionally, the fund offers a yield of over 5%. The weekly OBOS indicates that the fund is in overbought territory, so wait for the 10-week trading band to normalize before considering. Initial strong support between $23.50-$23.75, with additional support at $21.

The table below is a review of important technical data on a select group of KraneShares ETFs. Significant changes within the past week are highlighted in Green if positive or Red if negative. This portfolio is designed to be used as a "radar" screen to bring your attention to potentially important technical changes that may require your attention and potential action. When evaluating the Fund Score, the strongest issues have scores of 4 or higher while those ETFs with scores below a 3 are no longer considered solid citizens.
| Symbol | Name | Price | Yield (%) | PnF Trend | RS Signal | RS Col. | 200 Day MA | Weekly Mom | OBOS (Weekly) | ||
|---|---|---|---|---|---|---|---|---|---|---|---|
| KBA | KraneShares Bosera MSCI China A 50 Connect Index ETF | 31.87 | 1.57 | Positive | Buy | X | 27.07 | + 4W |
|
||
| KEMQ | KraneShares Emerging Markets Consumer Technology Index ETF | 27.12 | 5.24 | Positive | Buy | X | 22.13 | + 4W |
|
||
| KEMX | KraneShares MSCI Emerging Markets EX China Index ETF | 39.15 | 3.26 | Positive | Buy | X | 33.18 | + 3W |
|
||
| KGRN | KraneShares MSCI China Environment Index ETF | 28.51 | 0.85 | Positive | Buy | O | 27.70 | + 3W |
|
||
| KHYB | KraneShares Asia Pacific High Income USD Bond ETF | 24.68 | 7.59 | Negative | Sell | O | 24.18 | + 5W |
|
||
| KURE | KraneShares MSCI All China Health Care Index ETF | 19.24 | 4.16 | Positive | Buy | O | 18.22 | + 1W |
|
||
| KWEB | KraneShares CSI China Internet ETF | 37.66 | 6.12 | Positive | Buy | O | 34.43 | + 4W |
|
The distribution curve places each ETF on a bell curve according to their respective degrees of overbought or oversold status using a 10-week distribution. ETFs that are statistically oversold will appear on the left-hand side of the bell curve, while those that have become statistically overbought will appear on the right-hand side of the bell curve. Perhaps the most useful attribute of this feature is that it displays the entire universe on the curve at one time to give us a general picture of whether the KraneShares ETF universe is generally overbought on a near-term basis, or generally oversold. Our best opportunities are to buy strong relative strength ETFs that have regressed back toward mean conditions based on market weakness, or have become oversold based upon extreme market weakness. Weekly Distribution is a short-term gauge that is most helpful in timing entry and exit points, while the longer-term information of trend and relative strength is a more controlling factor in the decision of whether to buy or sell.
Average Level 63.41
< - -100
-100 - -80
-80 - -60
-60 - -40
-40 - -20
-20 - 0
0 - 20
20 - 40
40 - 60
60 - 80
80 - 100
100 - >
Buy signalkhyb
Buy signalKWEB
Buy signalKEMX
Sell signalKGRN
Sell signalKURE
Buy signalKBA
Buy signalKEMQ
< - -100
-100 - -80
-80 - -60
-60 - -40
-40 - -20
-20 - 0
0 - 20
20 - 40
40 - 60
60 - 80
80 - 100
100 - >
Legend:

The KraneShares Dynamic China Rotation Model is designed to identify major themes in the Chinese marketplace through the use of the Point & Figure relative strength tools. For more information on the portfolio construction and back testing, see the model info file on the models page. (Note: The KraneShares ETF Models will be updated Tuesday mornings by 9:30 am EST)
Weekly Changes:
| ETF Name | Symbol | NDW Suggested Weighting | Yield | Date Added |
|---|---|---|---|---|
| KraneShares CSI China Internet ETF TR | KWEB.TR | 25.000% | 6.1186 | 09/15/2025 |
| KraneShares MSCI All China Health Care Index ETF TR | KURE.TR | 25.000% | 4.1649 | 05/21/2025 |
| KraneShares Bosera MSCI China A 50 Connect Index ETF TR | KBA.TR | 25.000% | 1.5651 | 08/18/2025 |
| KraneShares Emerging Markets Consumer Technology Index ETF TR | KEMQ.TR | 25.000% | 5.2408 | 05/20/2024 |
* - Dates prior to 10/15/2019, which is when the KraneShares Dynamic China Rotation Model became available on the NDW Research Platform, are representative of when the position was added to the backtested model.
| ETF Name | Symbol | NDW Suggested Weighting | Yield | Date Added |
|---|---|---|---|---|
| KraneShares Bosera MSCI China A 50 Connect Index ETF TR | KBA.TR | 16.667% | 1.5651 | 08/29/2025 |
| KraneShares Emerging Markets Consumer Technology Index ETF TR | KEMQ.TR | 16.667% | 5.2408 | 09/30/2024 |
| KraneShares MSCI Emerging Markets Ex China Index ETF TR | KEMX.TR | 66.667% | 3.2589 | 12/31/2012 |
KraneShares (Tue.)
LISTEN TO PODCAST
Feb 12, 2026
NDW MORNING UPDATE
Feb 13, 2026
Loading, Please Wait...
