Most Requested Symbols


For the first time this year, there was a change to the Franklin International Equity Rotation model this week.
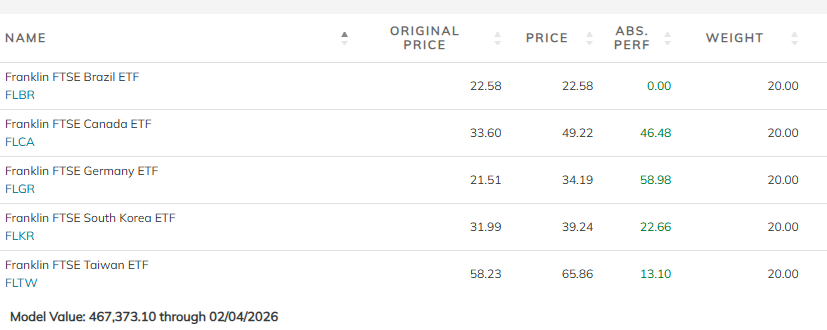
The Franklin FTSE China ETF (FLCH) was a holding within the Franklin model for around a year, gaining 18.2% over that span. However, the group has cooled off in recent months, seeing the FLCH’s fund score fall to a mediocre 3.61, in addition to falling into the bottom half of the model’s matrix. As a result, the fund was sold from the model. In its stead, the model is picking up the Franklin FTSE Brazil ETF (FLBR). Latin American equities have been one of the strongest areas of international equities, as well as the broader market. Within the Asset Class Group Scores page, Latin America currently holds the top position with an extremely robust average fund score of 5.48. FLBR holds a near-perfect fund score of 5.82, in addition to a sharply positive score direction of 3.64. At the end of January, the fund moved back to a buy signal and FLBR has also been trading in a positive trend dating back to March of last year. The fund also holds an extremely high yield of 6.50%. After the change, the model will rebalance its holdings back to equal weight. The model now has 20% exposure to Latin America, 20% in North America (FLCA), 20% in Europe (FLGR), and 40% in the Asia-Pacific region (FLKR & FLTW). The current model holdings are now as follows:

This section of the report categorizes select Franklin ETFs by their respective broad group. Along with each group, you can view the Average Group Score, which is an average of the scores of all funds represented in that particular group. Those Franklin ETFs that meet or exceed the Average Group Score will be highlighted in green in order to easily view those ETFs that have superior strength within their respective group. You want to focus on those ETFs that exhibit superior strength when looking to add new exposure to a particular group.
| Large Cap Funds | Symbol | Name | Score |
|---|---|---|---|
| Average Group Score: 4.1 | INCE | Franklin Income Equity Focus ETF | 5.57 |
| FLQL | Franklin US Large Cap Multifactor Index ETF | 5.21 | |
| UDIV | Franklin US Core Dividend Tilt Index ETF | 4.10 | |
| USPX | Franklin US Equity Index ETF | 3.76 |
| Small Cap Funds | Symbol | Name | Score |
|---|---|---|---|
| Average Group Score: 4.1 | FLQS | Franklin U.S. Small Cap Multifactor Index ETF | 2.76 |
| Global Funds | Symbol | Name | Score |
|---|---|---|---|
| Average Group Score: 3.9 | FLKR | Franklin FTSE South Korea ETF | 5.98 |
| FLMX | Franklin FTSE Mexico ETF | 5.91 | |
| FLBR | Franklin FTSE Brazil ETF | 5.82 | |
| FLTW | Franklin FTSE Taiwan ETF | 5.57 | |
| DIEM | Franklin Emerging Market Core Dividend Tilt Index ETF | 5.51 | |
| FLJH | Franklin FTSE Japan Hedged ETF | 5.49 | |
| FLCA | Franklin FTSE Canada ETF | 5.46 | |
| FLAX | Franklin FTSE Asia Ex Japan ETF | 5.41 | |
| DIVI | Franklin International Core Dividend Tilt Index ETF | 4.68 | |
| FLEE | Franklin FTSE Europe ETF | 4.61 | |
| FLGB | Franklin FTSE United Kingdom ETF | 4.59 | |
| FLGR | Franklin FTSE Germany ETF | 4.49 | |
| FLJP | Franklin FTSE Japan ETF | 4.42 | |
| FLSW | Franklin FTSE Switzerland ETF | 3.75 | |
| FLCH | Franklin FTSE China ETF | 3.61 | |
| FLAU | Franklin FTSE Australia ETF | 3.42 | |
| FLIN | Franklin FTSE India ETF | 1.72 |
| Mid Cap Funds | Symbol | Name | Score |
|---|---|---|---|
| Average Group Score: 3.8 | FLQM | Franklin U.S. Mid Cap Multifactor Index ETF | 4.34 |
| Global Fixed Income | Symbol | Name | Score |
|---|---|---|---|
| Average Group Score: 3.5 | FLIA | Franklin International Aggregate Bond ETF | 1.64 |
| High Yield | Symbol | Name | Score |
|---|---|---|---|
| Average Group Score: 3.1 | FLHY | Franklin High Yield Corporate ETF | 3.04 |
| Corporate Bonds | Symbol | Name | Score |
|---|---|---|---|
| Average Group Score: 2.9 | FLCO | Franklin Investment Grade Corporate ETF | 1.48 |
| Municipal Bonds | Symbol | Name | Score |
|---|---|---|---|
| Average Group Score: 2.9 | FLMI | Franklin Dynamic Municipal Bond ETF | 3.34 |
| FLMB | Franklin Municipal Green Bond ETF | 1.39 |
| Broad Fixed Income | Symbol | Name | Score |
|---|---|---|---|
| Average Group Score: 2.8 | FLBL | Franklin Senior Loan ETF | 0.06 |
| Treasury Bonds | Symbol | Name | Score |
|---|---|---|---|
| Average Group Score: 2.3 | FTSD | Franklin Short Duration US Government ETF | 1.34 |
The distribution curve places each ETF on a bell curve according to their respective degrees of overbought or oversold status using a 10-week distribution. ETFs that are statistically oversold will appear on the left-hand side of the bell curve, while those that have become statistically overbought will appear on the right-hand side of the bell curve. Perhaps the most useful attribute of this feature is that it displays the entire universe on the curve at one time to give us a general picture of whether the Franklin ETF universe is generally overbought on a near-term basis, or generally oversold. Our best opportunities are to buy strong relative strength ETFs that have regressed back toward mean conditions based on market weakness, or have become oversold based upon extreme market weakness. Weekly Distribution is a short-term gauge that is most helpful in timing entry and exit points, while the longer-term information of trend and relative strength is a more controlling factor in the decision of whether to buy or sell.
Average Level 44.79
< - -100
-100 - -80
-80 - -60
-60 - -40
-40 - -20
-20 - 0
0 - 20
20 - 40
40 - 60
60 - 80
80 - 100
100 - >
Buy signalFLQL
Buy signalFLQM
Buy signalFLJH
Buy signalflmi
Buy signalFLCH
Buy signalflmb
Buy signalFLTW
Buy signalFLMX
Buy signalflco
Buy signalftsd
Buy signalflqs
Buy signalFLAX
Buy signalflsw
Buy signalflgb
Buy signalflia
Sell signalflin
Buy signalflhy
Buy signalFLGR
Buy signalfljp
Buy signalflee
Buy signalFLKR
< - -100
-100 - -80
-80 - -60
-60 - -40
-40 - -20
-20 - 0
0 - 20
20 - 40
40 - 60
60 - 80
80 - 100
100 - >
Legend:

The Franklin LibertyShares International Model is designed to identify major country and regional themes in the international marketplace through the use of the Point & Figure relative strength tools. For more information on the portfolio construction and back testing, see the model info file on the models page. (Note: The Franklin LibertyShares ETF Models will be updated Thursday mornings by 9:30 am EST)
Weekly Changes:
| ETF Name | Symbol | NDW Suggested Weighting | Yield | Date Added |
|---|---|---|---|---|
| Franklin FTSE Brazil ETF | FLBR | 20.000% | 6.4965 | 02/04/2026 |
| Franklin FTSE Canada ETF | FLCA | 20.000% | 1.8359 | 08/11/2021 |
| Franklin FTSE Germany ETF | FLGR | 20.000% | 1.6898 | 08/23/2023 |
| Franklin FTSE South Korea ETF | FLKR | 20.000% | 3.0408 | 11/12/2025 |
| Franklin FTSE Taiwan ETF | FLTW | 20.000% | 2.2788 | 11/19/2025 |
* - Dates prior to 09/01/2018, which is when the Franklin LibertyShares ETF Model became available on the NDW Research Platform, are representative of when the position was added to the backtested model.
Franklin LibertyShares (Thurs.)
Loading, Please Wait...
