While much attention has been focused on the rally within more traditional energy sources, some clean energy stocks and funds have maintained a positive technical picture since last summer.
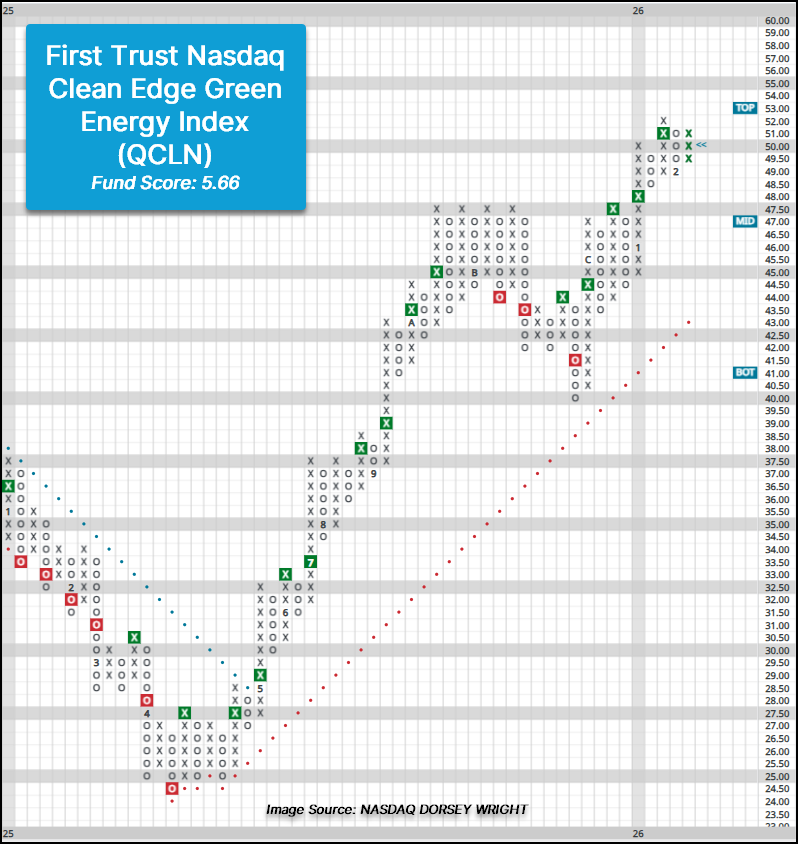
While much attention has been focused on the rally within more traditional energy sources, some clean energy stocks and funds have maintained a positive technical picture since last summer. Among those funds is the First Trust Nasdaq Clean Edge Green Energy Index Fund (QCLN), which has maintained an acceptable fund score since July 2025 and currently possesses a strong 5.66 fund score, higher than the current average score for energy funds (4.24) on the Asset Class Group Scores page.
QCLN has maintained a positive trend since May 2025 on the default trend chart and returned to a buy signal in the latter part of November. Action in January brought about additional buy signals along with a reversal back into Xs on the market relative strength chart, favoring QCLN in the near-term. After a move to $49 to kick off February, Tuesday’s (2/3) action led to a reversal back to Xs on the trend chart in actionable territory for those seeking exposure to clean energy. Initial support can be found in the $48.50 to $49 range, while additional support lies in the mid-to-lower $40s with the bullish support line at $43.
QCLN is currently a holding within both the First Trust Thematic Focus Five Model (FTTHEME5.TR) along with the First Trust Sector Model (FTRUST). Year-to-date, the fund has gained north of 13%, outperforming the S&P 500 Index (SPX) by more than 12%.