Most Requested Symbols

NDW is Trilled to Announce a Partnership with Nitrogen Wealth, bring risk scoring to the platform. In this feature, we discuss new enhancements to the platform and how you can take advantage of the new tools in your practice.
NDW Morning Pulse - November 20, 2026
Below are highlights from the NDW Morning Update Video for the morning of 11/19/2026. Access the video on the NDW Morning Update Video page.

There are two sides to every asset: the return it delivers and the risk required to achieve that return. Risk is the price of admission for participating in the potential return available across the investment landscape. Some securities, like U.S. Treasuries, carry relatively little risk, but often come with equally modest return expectations. Others can offer tremendous upside, but only in exchange for accepting substantially greater uncertainty. Just as different assets within a portfolio carry different levels of risk, every client has a unique risk profile. Job security, income, age, investment horizon, and even personality can influence how much risk an individual is willing and able to take within their portfolio. As money managers, our job is to understand each client’s circumstances and build investment solutions that align with their risk appetite.
To help advisors do just that, NDW is thrilled to announce a partnership with one of the industry’s premier risk assessment platforms: Nitrogen Wealth (formerly Riskalyze).
The Nitrogen Risk Score
Nitrogen Wealth is best known for the speed limit scoring system, quantifying risk from a range of 0 (cash-like) to 99 (highly volatile, single stock exposure). Just as every investment can be evaluated through this framework, each client can also be assigned a Risk Score. The objective is straightforward: align the risk characteristics of a client’s portfolio with the level of risk they are comfortable taking. Nitrogen’s methodology incorporates several measures of risk, including drawdown, volatility, and correlation statistics, to provide a simple and intuitive way to evaluate portfolio risk. For reference, S&P 500 representative SPY score comes in at a 70 as of November 2026. Broad fixed income fund AGG earns a 30 score.
For more information on the Risk Score and how it is calculated, click here.

Risk-Benchmarked Models
Understanding risk is one thing. The next logical step is using that information to build more efficient tactical solutions across the risk spectrum. With that objective in mind, NDW has designed a suite of risk-benchmarked models that seek to generate more return for each unit of risk taken, as measured through Nitrogen’s scoring system. Ranging from “conservative income” with a Risk Score near 30 to “aggressive growth” near 60, these nine models use a completely new tactical asset class ranking alongside predefined risk objectives. The result is a suite of tactical, risk-benchmarked solutions designed to fit more naturally within a client’s broader portfolio. You can find these new strategies featured on the NDW model’s page, highlighted below.
These models are built around NDW’s new RSM framework, which will soon be available within the custom model tool. The framework will allow you to create customized, broad asset-class models with a specific risk target in mind, bringing risk considerations to the forefront of the portfolio-construction process.
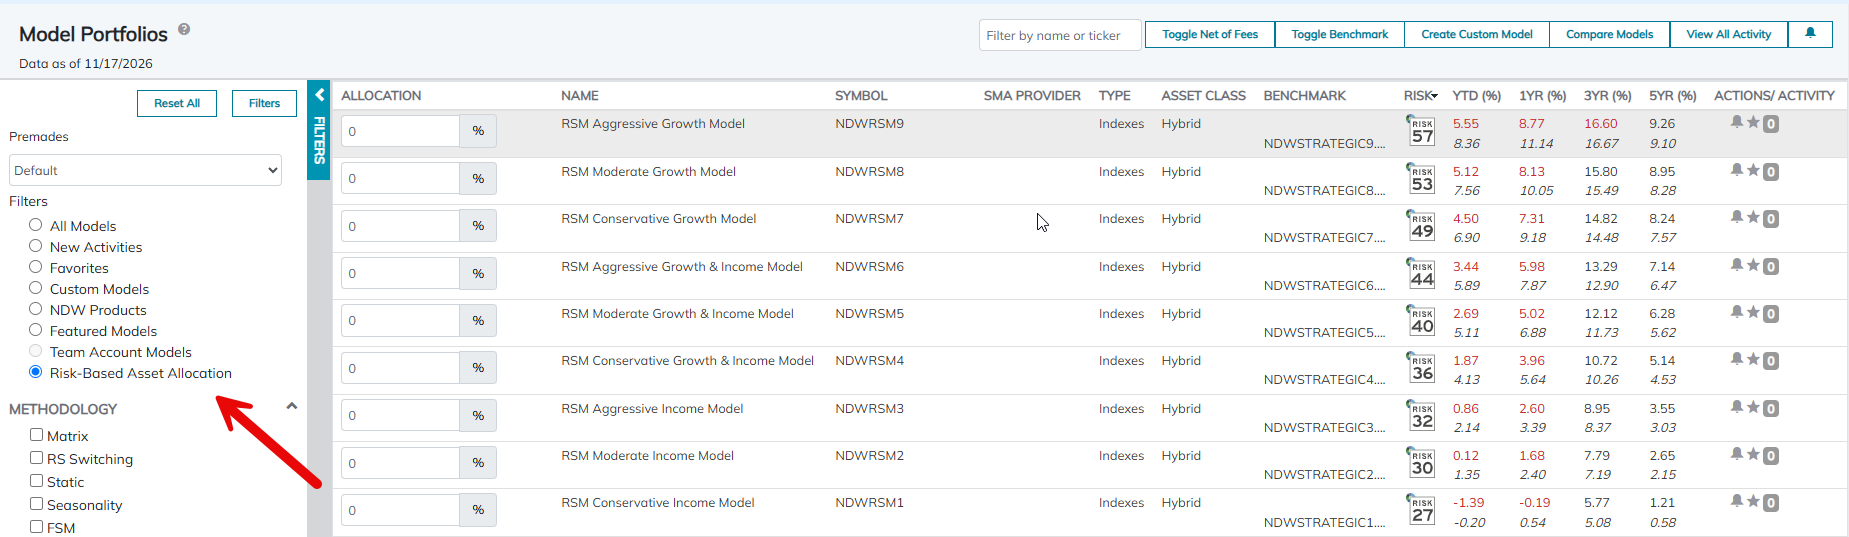
Pre-Made NDW Models & Risk Scores
Until now, determining exactly where a tactical model on the NDW platform falls along the risk spectrum has not always been easy. While NDW offers several ways to evaluate risk, translating those metrics into something that is simple and intuitive for clients has been challenging, until now.
Using each model’s price stream from 2004 to present, NDW can now calculate monthly Risk Scores, making it easier to understand where a model fits across the risk spectrum. In seconds, you can determine whether a model aligns with a client’s risk budget or whether another solution may be more appropriate. This opens more time for you to focus on what matters most; serving current clients and building new relationships.

Alongside Risk Scores, NDW is introducing a brand-new Risk Center that allows you to drill into specific periods, such as the Global Financial Crisis or the 2022 bear market, and see how a model’s risk/return profile stacked up through different market environments. Note, an analyst favorite here is the ability to drilldown into strategy performance during momentum expansions and momentum contractions, helping you answer the question, “How does this model do during periods of rotation?” We also detail individual risk scores for the entire model’s universe, giving you a convenient place to see if a model’s holdings are more “risk-on” or “risk-off” at any one point in time. For those of you building custom model solutions, these capabilities will extend beyond NDW premade model suite. Coming soon, you can also score and preview custom model risk metrics, providing a new way to evaluate bespoke strategies through the same risk framework.

Risk Scores Across the NDW Platform
The enhancements do not stop with models. NDW has also scored more than 10,000 securities across our database. From individual stocks and ETFs to mutual funds and commodities, Risk Scores will be displayed directly on an asset’s chart page, providing another layer of information when evaluating an investment. Just as NDW’s Technical Attributes offer a quick perspective on the strength of an asset’s technical picture, Nitrogen Risk Scores provide an at-a-glance view of its risk profile. Together, these tools can help you evaluate not only whether an investment looks attractive from a technical perspective, but also whether the risk required to own it makes sense within a particular portfolio.
Summary
Ultimately, these enhancements are designed around two simple goals; saving you time and helping you build better solutions for your clients. By bringing Nitrogen’s intuitive risk framework into the NDW platform, you will be able to more easily evaluate securities, compare tactical models, build customized solutions, and connect portfolio decisions back to the level of risk each client is prepared to take.
Preview access is being provided for a limited time. Following the Preview period, Nitrogen Risk Scoring is expected to become a premium, paid add-on to your Research Platform subscription. We’ll provide additional information on availability, features and pricing before the Preview concludes. We encourage users to explore the new tools during the Preview period and see how they can fit into their risk evaluation and portfolio construction process. We also welcome feedback about the tool.
To ask questions or provide feedback about Nitrogen and its role on the NDW platform, please email: miles.clark@nasdaq.com. For those wanting to see a demo of the improvements live, join our analyst team at this live webinar on December 8th at 2PM EST. Join HERE
Average Level
-44.61
| < - -100 | -100 - -80 | -80 - -60 | -60 - -40 | -40 - -20 | -20 - 0 | 0 - 20 | 20 - 40 | 40 - 60 | 60 - 80 | 80 - 100 | 100 - > |
|---|---|---|---|---|---|---|---|---|---|---|---|
|
Buy signalGCC
|
Buy signalijr
|
||||||||||
|
Sell signalfxe
|
Sell signalqqq
|
Sell signallqd
|
Sell signalshy
|
||||||||
|
Sell signalgld
|
Sell signalvoog
|
Buy signalSPY
|
Buy signaldia
|
Sell signalagg
|
Sell signaldvy
|
||||||
|
Sell signaleem
|
Buy signalxlg
|
Buy signalefa
|
Sell signalhyg
|
Buy signalVOOV
|
Buy signalief
|
||||||
|
Sell signalGSG
|
Sell signaloneq
|
Sell signalUSO
|
Buy signaliwm
|
Buy signalIJH
|
Sell signaltlt
|
Buy signalrsp
|
Buy signalicf
|
Buy signaldx/y
|
|||
| < - -100 | -100 - -80 | -80 - -60 | -60 - -40 | -40 - -20 | -20 - 0 | 0 - 20 | 20 - 40 | 40 - 60 | 60 - 80 | 80 - 100 | 100 - > |
| AGG | iShares US Core Bond ETF |
| USO | United States Oil Fund |
| DIA | SPDR Dow Jones Industrial Average ETF |
| DVY | iShares Dow Jones Select Dividend Index ETF |
| DX/Y | NYCE U.S.Dollar Index Spot |
| EFA | iShares MSCI EAFE ETF |
| FXE | Invesco CurrencyShares Euro Trust |
| GLD | SPDR Gold Trust |
| GSG | iShares S&P GSCI Commodity-Indexed Trust |
| HYG | iShares iBoxx $ High Yield Corporate Bond ETF |
| ICF | iShares Cohen & Steers Realty ETF |
| IEF | iShares Barclays 7-10 Yr. Tres. Bond ETF |
| LQD | iShares iBoxx $ Investment Grade Corp. Bond ETF |
| IJH | iShares S&P 400 MidCap Index Fund |
| ONEQ | Fidelity Nasdaq Composite Index Track |
| QQQ | Invesco QQQ Trust |
| RSP | Invesco S&P 500 Equal Weight ETF |
| IWM | iShares Russell 2000 Index ETF |
| SHY | iShares Barclays 1-3 Year Tres. Bond ETF |
| IJR | iShares S&P 600 SmallCap Index Fund |
| SPY | SPDR S&P 500 Index ETF Trust |
| TLT | iShares Barclays 20+ Year Treasury Bond ETF |
| GCC | WisdomTree Continuous Commodity Index Fund |
| VOOG | Vanguard S&P 500 Growth ETF |
| VOOV | Vanguard S&P 500 Value ETF |
| EEM | iShares MSCI Emerging Markets ETF |
| XLG | Invesco S&P 500 Top 50 ETF |

| Symbol | Company | Sector | Current Price | Action Price | Target | Stop | Notes |
|---|---|---|---|---|---|---|---|
| URI | United Rentals, Inc. | Machinery and Tools | $1088.32 | 1040s - 1100s | 1312 | 896 | 5 for 5'er, top 20% of MACH sector matrix LT pos peer & mkt RS, spread triple top, buy on pullback |
| BCO | The Brink's Company | Protection Safety Equipment | $116.44 | 100s - low 110s | 147 | 91 | 4 for 5'er, top third of favored PROT sector matrix, LT pos peer RS |
| CTAS | Cintas Corporation | Textiles/Apparel | $222.00 | mid-210s to hi 220s | 290 | 184 | 4 for 5'er, top quartile of Textile matrix, LT Mkt. RS Buy since Mar. '15, ATH on 11/5., Earn. 12/17 |
| CBL | CBL & Associates Properties, Inc. | Real Estate | $51.39 | low-to-mid 50s | 72 | 46 | 5 for 5'er, top 25% of REAL sector matrix, LT pos peer RS, bearish signal reversal, R-R~2.0, 4.7% yield |
| ALSN | Allison Transmission Holdings Inc | Transports/Non Air | $124.91 | 120s - low 130s | 156 | 104 | 4 for 5'er, top third of TRAN sector matrix, LT pos peer & mkt RS, triple top, pos trend flip |
| ALL | The Allstate Corporation | Insurance | $266.59 | hi 250s - low 270s | 404 | 228 | 4 for 5'er, Pos. ST and LT Mkt. RS, One box from Peer RS Buy, Top third of Insurance matrix. |
| ARMK | Aramark | Food Beverages/Soap | $56.85 | mid-to-upper 50s | 70 | 48 | 5 for 5'er, LT pos peer & mkt RS, spread triple top, good R-R, 1% yield |
| APG | APi Group Corporation | Building | $42.65 | 40 - 46 | 70 | 35 | 4 for 5'er, top half of Building matrix, Pos. LT Mkt. and Peer RS, Pos. Trend. |
| Symbol | Company | Sector | Current Price | Action Price | Target | Stop | Notes |
|---|
| Symbol | Company | Sector | Current Price | Action Price | Target | Stop | Notes |
|---|---|---|---|---|---|---|---|
| XOM | ExxonMobil Holdings Corp. | Oil | $160.58 | hi150s - hi 160s | 206 | 134 | Sell signal at $160 on 11/19. Raise stop to $148. |
| CNC | Centene Corporation | Healthcare | $67.45 | hi 60s - low 70s | 105 | 59 | Sell signal at $67 on 11/18. Maintain $59 stop. |
| VOYA | ING US Inc. | Finance | $98.55 | 99 - 106 | 123 | 88 | Sell signal at $97 on 11/19. Raise stop to $91. |
| Comment | |||||||
|---|---|---|---|---|---|---|---|
|
|
|||||||
APG APi Group Corporation R ($42.02) - Building - APG has been at least a 3 for 5’er in technical attribute rating since January 2023 and moved up to a 4 for 5’er in October 2026 after seeing the peer RS chart shift to a column of Xs, highlighting near-term outperformance. APG has maintained long-term positive market RS since May 2020 and long-term positive peer RS since April 2024, while currently ranking within the top half of the building sector matrix. On the trend chart, APG has maintained a positive since February 2023 and returned to a buy signal at the end of October 2026 by breaking a triple top at $45. After rallying up to $47 at the beginning of November, the stock has pulled back and consolidated within the lower $40s. Okay to consider in the $40 to $46 range. The bullish price objective of $70 will serve as the price target, while the initial stop loss will be set for $35.
| 23 | 24 | 25 | 26 | ||||||||||||||||||||||||||
| 49.00 | X | Top | 49.00 | ||||||||||||||||||||||||||
| 48.00 | X | O | 48.00 | ||||||||||||||||||||||||||
| 47.00 | X | O | X | 47.00 | |||||||||||||||||||||||||
| 46.00 | X | X | O | B | O | 46.00 | |||||||||||||||||||||||
| 45.00 | X | O | X | 5 | X | O | 45.00 | ||||||||||||||||||||||
| 44.00 | 2 | O | X | O | X | X | X | O | X | 44.00 | |||||||||||||||||||
| 43.00 | X | 3 | X | O | X | O | X | O | X | O | X | 43.00 | |||||||||||||||||
| 42.00 | X | O | X | 4 | O | X | O | 8 | O | X | O | X | 42.00 | ||||||||||||||||
| 41.00 | 1 | O | X | O | X | O | X | O | X | O | X | O | X | 41.00 | |||||||||||||||
| 40.00 | C | O | X | O | X | 6 | 7 | X | O | X | O | Mid | 40.00 | ||||||||||||||||
| 39.00 | X | O | O | O | X | 9 | A | 39.00 | |||||||||||||||||||||
| 38.00 | X | O | O | X | 38.00 | ||||||||||||||||||||||||
| 37.00 | B | O | X | 37.00 | |||||||||||||||||||||||||
| 36.00 | X | O | 36.00 | ||||||||||||||||||||||||||
| 35.00 | 7 | 35.00 | |||||||||||||||||||||||||||
| 34.00 | X | 34.00 | |||||||||||||||||||||||||||
| 33.00 | 6 | 33.00 | |||||||||||||||||||||||||||
| 32.00 | X | 32.00 | |||||||||||||||||||||||||||
| 31.00 | X | Bot | 31.00 | ||||||||||||||||||||||||||
| 30.00 | X | 30.00 | |||||||||||||||||||||||||||
| 29.00 | X | 29.00 | |||||||||||||||||||||||||||
| 28.00 | X | 28.00 | |||||||||||||||||||||||||||
| 27.00 | X | 2 | X | 27.00 | |||||||||||||||||||||||||
| 26.00 | X | C | O | X | O | 5 | 26.00 | ||||||||||||||||||||||
| 25.00 | 3 | O | X | O | X | O | X | 25.00 | |||||||||||||||||||||
| 24.00 | 2 | O | B | O | 3 | X | 24.00 | ||||||||||||||||||||||
| 23.00 | X | 8 | X | 4 | X | 23.00 | |||||||||||||||||||||||
| 22.00 | X | O | X | O | X | 22.00 | |||||||||||||||||||||||
| 21.00 | C | A | O | 21.00 | |||||||||||||||||||||||||
| 20.00 | X | • | 20.00 | ||||||||||||||||||||||||||
| 19.50 | 8 | X | • | 19.50 | |||||||||||||||||||||||||
| 19.00 | X | O | X | • | 19.00 | ||||||||||||||||||||||||
| 18.50 | 7 | O | X | • | 18.50 | ||||||||||||||||||||||||
| 18.00 | X | O | B | • | 18.00 | ||||||||||||||||||||||||
| 17.50 | X | 9 | X | • | 17.50 | ||||||||||||||||||||||||
| 17.00 | X | O | X | • | 17.00 | ||||||||||||||||||||||||
| 16.50 | • | X | A | • | 16.50 | ||||||||||||||||||||||||
| 16.00 | • | X | 6 | • | 16.00 | ||||||||||||||||||||||||
| 15.50 | • | X | O | 5 | • | 15.50 | |||||||||||||||||||||||
| 15.00 | 2 | O | X | • | 15.00 | ||||||||||||||||||||||||
| 14.50 | X | 3 | X | • | 14.50 | ||||||||||||||||||||||||
| 14.00 | O | X | O | X | • | 14.00 | |||||||||||||||||||||||
| 13.50 | O | 1 | O | • | 13.50 | ||||||||||||||||||||||||
| 13.00 | 4 | X | • | 13.00 | |||||||||||||||||||||||||
| 12.50 | O | X | • | 12.50 | |||||||||||||||||||||||||
| 12.00 | 5 | 8 | X | • | 12.00 | ||||||||||||||||||||||||
| 11.50 | O | X | O | B | • | 11.50 | |||||||||||||||||||||||
| 11.00 | O | 7 | O | X | • | 11.00 | |||||||||||||||||||||||
| 10.50 | 6 | X | O | A | • | 10.50 | |||||||||||||||||||||||
| 10.00 | O | X | 9 | X | • | 10.00 | |||||||||||||||||||||||
| 9.50 | O | O | X | • | 9.50 | ||||||||||||||||||||||||
| 9.00 | O | • | 9.00 | ||||||||||||||||||||||||||
| 23 | 24 | 25 | 26 |
| ANF Abercrombie & Fitch Co. ($140.33) - Retailing - ANF broke a double bottom at $140 to complete a bearish catapult and count as the third sell signal since reaching the November peak at $170. The stock maintains a 5 for 5'er currently, but the market and peer RS charts reside within one box of reversing down into Os. On the trend chart, support can be found at $138, while additional can be seen in the $130 to $132 range. |
| BLK BlackRock, Inc. ($1,141.87) - Wall Street - BLK shares moved lower today to break a double bottom at $1152 to mark its first sell signal. This 4 for 5'er has been in a positive trend since July and on an RS buy signal versus the market since October 2020. BLK shares are trading in normalized territory with a weekly overbought/oversold reading of 35%. From here, support is offered at $1024. |
| C Citigroup, Inc. ($115.30) - Banks - C shares moved lower today to break a double bottom to mark its fourth consecutive sell signal. This 3 for 5'er has been in a positive trend since May 2025 and on an RS buy signal versus the market since January 2025. C shares are trading below their ten-week moving average with a weekly overbought/oversold reading of -55%. From here, support is offered at $108. |
| ELV Elevance Health Inc. ($391.30) - Healthcare - ELV fell Thursday to break a double bottom at $400 before falling to $384 intraday. This caused the stock to move to a negative trend, demoting it to a 2 for 5 TA rating. The weight of the technical evidence is weak and deteriorating. Weekly momentum also just flipped negative, suggesting the potential for further downside. Avoid long exposure. Further support is seen at $376. Overhead resistance can be seen at $448. |
| ETSY Etsy Inc ($81.00) - Retailing - ETSY broke a double bottom at $81 for a third sell signal since reaching the November rally high at $97. The stock continues to maintain a 5 technical attribute rating, but the breakdown brings the chart down to test the bullish support line at $80, which would be violated with a move into the $70s. Beyond the bullish support line, support can be found in the mid $60s. |
| GOOGL Alphabet Inc. Class A ($273.94) - Internet - GOOGL posted a triple bottom sell signal with today's action, matching 2026 lows near the bottom of the trading band. The break solidifies some resistance around $304, and the technical picture has certainly worsened since our last comment. Feel free to cut exposure on bounces.... at the very least we shouldn't be adding more until the technical picture clears up. |
| GS Goldman Sachs Group, Inc. ($850.51) - Wall Street - GS shares moved lower today to break a spread triple bottom at $848 to mark its fifth consecutive sell signal and enter a negative trend. This 2 for 5'er has been on an RS buy signal versus the market since May 2024. GS shares are trading below their ten-week moving average with a weekly overbought/oversold reading of -36%. From here, support is offered at $800. |
| MS Morgan Stanley ($175.28) - Wall Street - MS shares moved lower today to break a double bottom at $180 to mark its second consecutive sell signal. This 2 for 5'er has been in a negative trend since earlier this month but has been on an RS buy signal versus the market since June 2013. MS shares are trading below their ten-week moving average with a weekly overbought/oversold reading of -42%. From here, support is offered at $162. |
| MTRN Materion Corp. ($201.55) - Chemicals - After giving two consecutive sell signals, MTRN returned to a buy signal Thursday when it broke a double top at $204. The outlook for the stock remains negative, however, as MTRN is a 0 for 5'er and ranks near the bottom of the chemicals sector matrix. From here, the next level of overhead resistance sits at $212 while support can be found at $192. |
| WSM Williams-Sonoma, Inc. ($217.99) - Retailing - WSM broke a double bottom at $240 for a second sell signal as shares fell to $220, marking the lowest level since September. The stock continues to maintain a 5 technical attribute rating, but the breakdown brings the market and peer RS charts to within one box of reversing down into Os. Support lies at current chart levels as well as at $216, while additional can be found at $200, the bullish support line. |
| XOM ExxonMobil Holdings Corp. ($158.63) - Oil - XOM fell to a sell signal Thursday when it broke a double bottom at $160, where it now sits against its bullish support line; a move to $158 would violate XOM's trend line and drop it to a 4 for 5'er. The outlook for the stock remains positive despite Thursday's move as XOM is a 5 for 5'er that ranks in the top third of the oil sector matrix. |

The option suggestions featured here are pulled from the NDW Options Ideas tool. These are just a sample of the ideas that can be found there. The Options Idea tool contains numerous additional income and speculative plays. It also offers relative strength-based screens targeting the highest (and lowest) relative strength stocks and ETFs that have recently moved counter to their longer-term trend. To access or subscribe to the Options Ideas tool, click here.
Call
Lockheed Martin Corporation (LMT) March 19th $570 Call:

| Additional Data: | |
| Bid/Ask Spread | 15.31% |
| Delta | 57.57 |
| Gamma | 0.42 |
| Implied Volatility | 31.15% |
| Expiry Date | 3/19/2027 |
| Earnings Date | 1/26/2027 |
Put
Blackstone (BX) January 15th $120 Put:

| Additional Data: | |
| Bid/Ask Spread | 3.90% |
| Delta | -52.44 |
| Gamma | 2.40 |
| Implied Volatility | 36.87% |
| Expiry Date | 1/15/2027 |
| Earnings Date | - |
Income
Costco (COST) December 18th 1180 Covered Call:

| Additional Data: | |
| Ann. Static Return | 11.90% |
| Bid/Ask Spread | 5.00% |
| Delta | 77.14 |
| Gamma | -0.38 |
| Implied Volatility | 26.72% |
| Expiry Date | 12/18/2026 |
| Earnings Date | 12/10/2026 |
Daily Equity & Market Analysis
Loading, Please Wait...

