Several different areas within the commodities space have heat up recently. We explore this movement in today's featured article
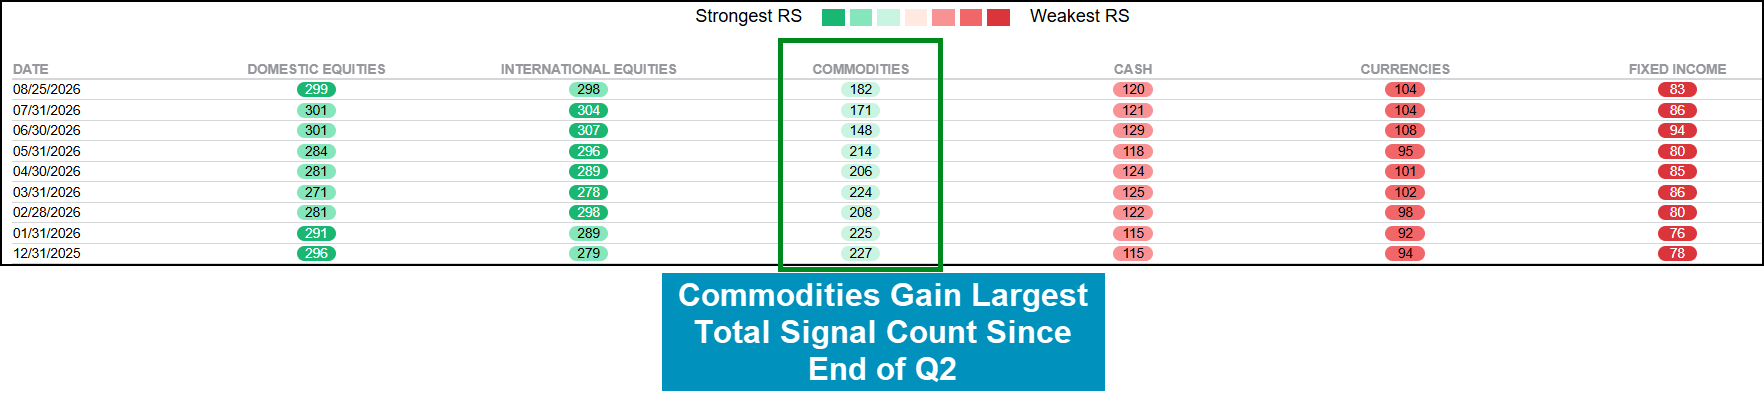
With all that has been going on in the equity space, it has been easy to miss several interesting developments that have occurred within commodities. Since the end of the second quarter on 6/30, the commodities group has seen a 22% increase in overall signal count in DALI… all while both international and domestic equities have remained largely static in their tallies. While commodities is still a far cry away from being in the contention for the top two spots, it goes without saying that the group has perked up nicely over the last few months. That said, it is worth exploring some of the individual technical postures of the space to properly judge whether the movement could lead to more upside or lose its fizzle heading out of summer.
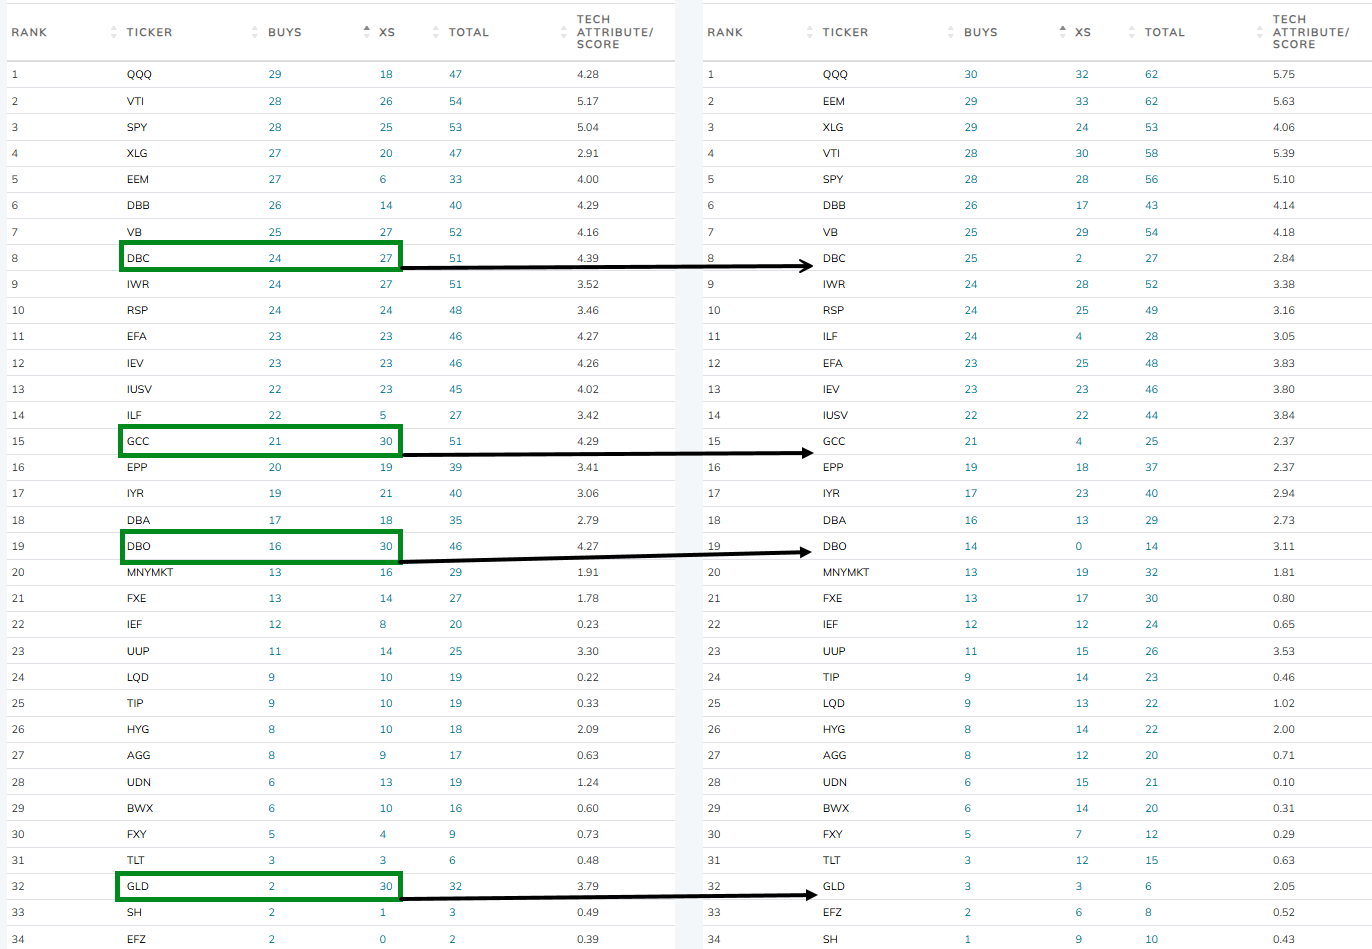
Perhaps the most convincing argument for more “sustained upside” is that the improvement has been somewhat broad. The screenshot below depicts rankings within NDW’s premade asset class matrix - a matrix which ranks 34 different major asset class representatives against each other. While many of the commodity representatives (highlighted below) maintain their overall ranking, note the substantial uptick in near-term X counts. Between DBC, GCC, DBO and GLD alone commodity representatives have seen their overall X tally increase by more than 108. In fact, when sorting by X-Rank (rather than our default buy rank) commodity representatives earn four of the top five slots, joined by small cap growth towards the top of the heap. While we don’t suggest sorting entirely by X-rank due to frequent possible whipsaws, it can be useful when looking to add context to large, near-term relative moves.
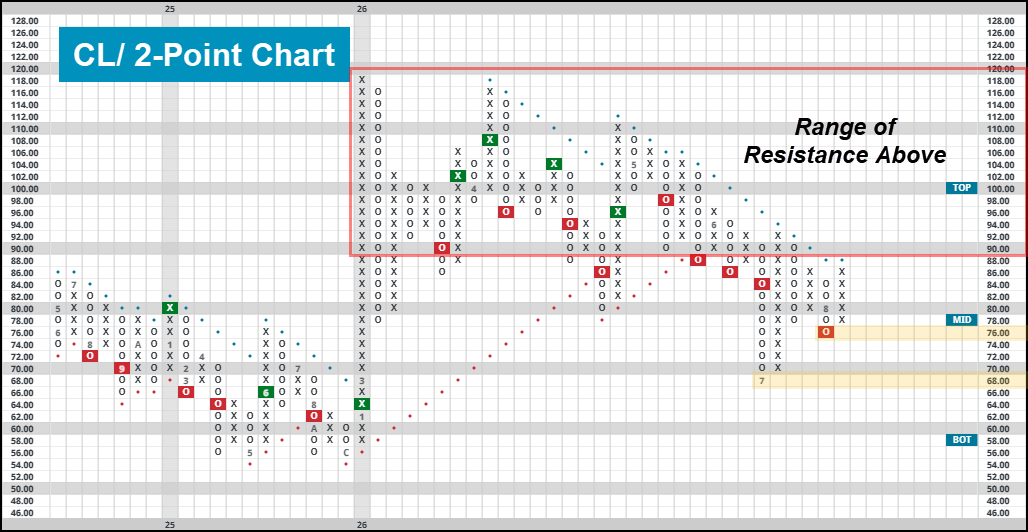
Lots of the broad commodity funds are dominated by energy focused exposure, so it’s no surprise that further upside from crude oil has given the asset class a bit of a facelift over the last few months. While the energy space is still largely dependent on headlines coming out of the Middle East, crude has continued to flirt with a seemingly key $80 mark. The 2-point chart highlighted below details key levels of support and (mainly) resistance worth watching. While it would be quite difficult to express a bullish posture on the chart below, it’s worth mentioning that the rapid increases off lows for many options within the energy complex has brought the energy group back to the top of the intra-commodity DALI rankings and back above an average score of 3.0 on the ACGS page.
Outside of the energy space, precious metals have perked up quite nicely despite continuing to trade well off respective highs from the start of 2026. Gold (GC/) is trading above the top of its trading band, showing some nice follow-through after completing a bullish triangle on its default chart in mid-August. It faces tough sledding ahead with various levels of resistance between current levels and those all-time highs, but the magnitude of upside participation has been intense.
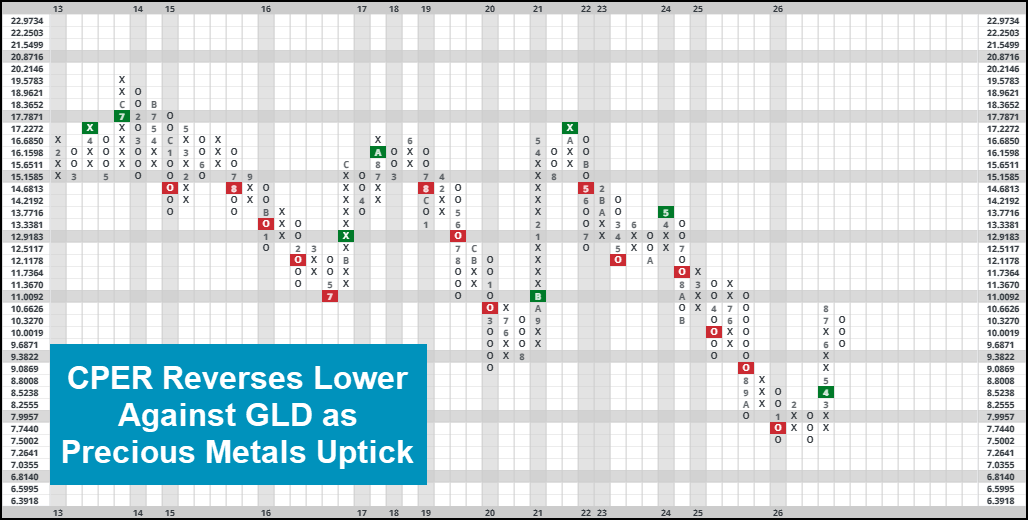
This upside action has also led to some significant RS changes within the commodity space. One key relationship we typically look towards is a 3.25% relative strength chart between representative GLD and CPER. Due to its more economically useful applications in building, manufacturing, etc., CPER leadership is associated with more risk-on leadership vs. gold strength, which is typically associated with periods of uncertainty (sans the last few years during which gold accelerated alongside an equity bull market…) All that to say, with gold’s uptick this relationship moved back down into O’s. While following every reversal isn’t more productive than holding either asset on its own, following every signal has been historically.
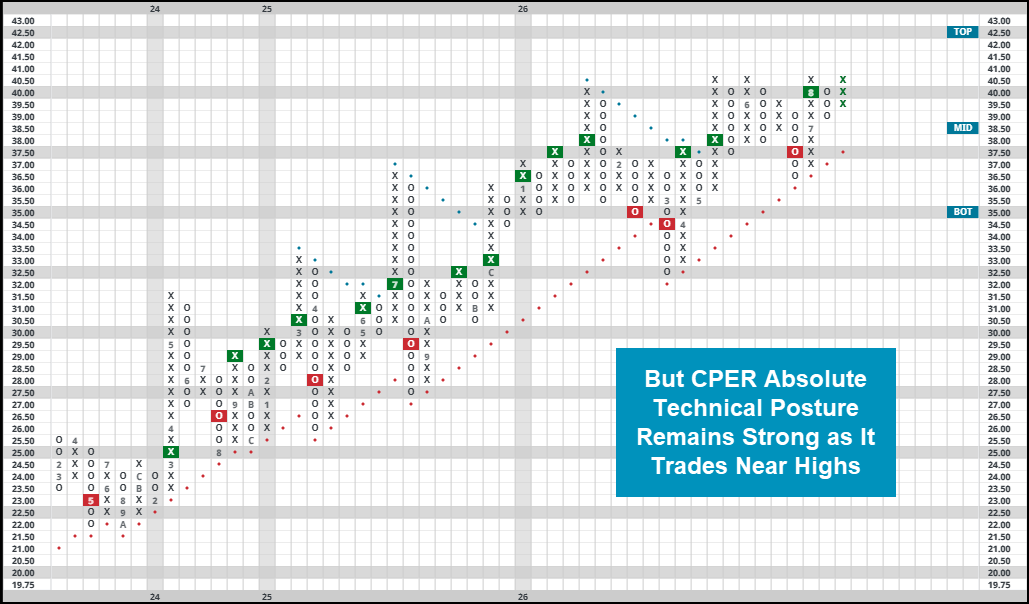
Lastly, we will look at the other side of this RS relationship. Despite some relative weakness vs. gold, that certainly isn’t to say that copper (or other base metals for that matter) haven’t joined in on the fun over the last few months. The chart for CPER is included below. It earns a strong 4.84 fund score as of 8/26, reversing higher on its default chart to a reading of $40.50, matching all-time chart highs from earlier this year. Having gained just under 17% so far in 2026, it is outperforming major domestic equity benchmarks as we move into September.
Remember, for many commodities it is still far too early to tell if the recent action is part of a larger move higher or just another “lower high” for a lackluster asset class. As always, continue to monitor the charts, matrices and daily equity report for further context to overall movement.