| Welcome: |
|
| Lesson 2: |
Part 1. Chart Patterns |
Battle Between Supply and Demand.
|
The PnF Chart depicts the battle between Supply and Demand. There are two basic signals that develop. They are the Double Top Buy signal and the Double Bottom Sell signal. These are the two most basic patterns and it is imperative that you understand them.
|
 |
 |
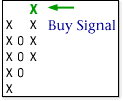
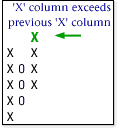
| A buy signal shows demand is in control
of the stock. It occurs when a column of X's exceeds the previous colomn of
X's. |
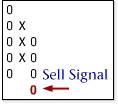
A sell signal shows supply is in control. In this case the stock exceeded the previous column of O's. |
|
|
The Double Top Break
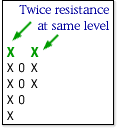
A double top break occurs when a chart, in X's, runs into resistance. Supply gains control and the chart reverses into O's. Demand then regains control of the chart and it reverses back into X's where it rallies to the previous resistance. Here the double top is formed. When the chart is able to exceed this resistance level and rise another box it gives the double top break.
The Double Bottom Break
A double bottom break occurs when a chart, in O's, falls to support. Demand gains control and the chart reverses into X's. Supply then regains control of the chart and it reverses back into O's where it falls to the previous support. Here the double bottom is formed. When the chart is able to exceed this support level and fall another box it gives the double bottom break.
|
Double
Top
 |
Double
Top Break
 |
Double Bottom
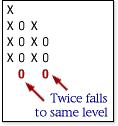 |
Double
Bottom Break
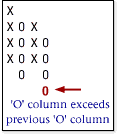 |
|
The Supply and Demand Scenario.
Double Top:
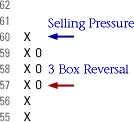 1) For example, XYZ rises
to $60 and meets selling pressure. This selling pressure exceeds
the demand at that price and the stock retreats. Remember, it requires a three-box reversal to change columns. In this example, the selling pressure was enough to force XYZ back to $57, the chart reverses to O's from X's. 1) For example, XYZ rises
to $60 and meets selling pressure. This selling pressure exceeds
the demand at that price and the stock retreats. Remember, it requires a three-box reversal to change columns. In this example, the selling pressure was enough to force XYZ back to $57, the chart reverses to O's from X's. |
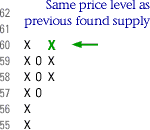 2)
Over the next few weeks demand once again creeps back into the
stock and causes the price to rise to $60 per share. This
is causes a three-box reversal back up into a column of X's, and
XYZ now sits at the same level that previously caused supply to enter the market. 2)
Over the next few weeks demand once again creeps back into the
stock and causes the price to rise to $60 per share. This
is causes a three-box reversal back up into a column of X's, and
XYZ now sits at the same level that previously caused supply to enter the market. |
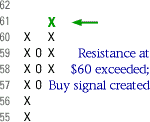 3)
The question now is whether the sellers that forced the stock
back before are still there. The only way to find out if the
sellers are still operating at that price is to see how XYZ negotiates
that level. 3)
The question now is whether the sellers that forced the stock
back before are still there. The only way to find out if the
sellers are still operating at that price is to see how XYZ negotiates
that level. |
If
it is again repelled, then the sellers are still there. If it
instead is able to move to $61, then we can say that demand has
prevailed at this price by exceeding the level where supply had
previously gained control. By exceeding this level of resistance
the Point and Figure chart gives its most basic buy signal, the
Double Top Break.
Demand is now in control of this stock. |
Double Bottom:
 1)
In this pattern, supply wins
the match. Instead of XYZ exceeding the previous point of resistance,
it instead reversed and exceeded the previous level of support.
Here the stock first reverses down
into O's to the 54 level. 1)
In this pattern, supply wins
the match. Instead of XYZ exceeding the previous point of resistance,
it instead reversed and exceeded the previous level of support.
Here the stock first reverses down
into O's to the 54 level. |
 2) Demand comes into the stock with
the price rising to 57 and reverses the chart into a column of
X's. 2) Demand comes into the stock with
the price rising to 57 and reverses the chart into a column of
X's. |
 3) The stock encounters selling pressure
which drives XYZ back down the chart to the 54 level where demand
previously took control providing support. However this time,
the buyers are not there as before and the selling pressure persists
until the stock exceeds that level of support. 3) The stock encounters selling pressure
which drives XYZ back down the chart to the 54 level where demand
previously took control providing support. However this time,
the buyers are not there as before and the selling pressure persists
until the stock exceeds that level of support.
Supply again takes over and the chart reverses back down to 53
exceeding the support at 54 and creating a double bottom sell
signal at 53.
|
Summary:
Supply wins and the probability of lower prices come into play.
The reason supply overtook demand is not important. What is important is knowing that supply is in control, for in the end, supply and demand cause stocks to move up and down and nothing else. |
More Examples:
Here the stock rises to $60 a second time where it is repelled. This shows there is resistance at that level. The column of O's exceeding the previous column of O's gives the double bottom sell signal, one of the most basic patterns. At this point we do not have enough pieces of the puzzle to say whether to sell the stock. As we continue through the university all the different pieces will start to come together. |
 |
| This stock found good support at 54. This is clearly shown on the chart as the price where columns of O's stopped. This is one of the great advantages of Point and Figure charts. They are as clear as it gets. There is no mistaking whether a stock gave a buy or sell signal. In this example, after holding the support, demand regains control and exceeds the previous top at $57 giving the double top buy signal. |
 |
The Bullish Signal
| We
add one more dimension, an added clue, to the pattern this time.
In this next pattern, the last column of O's does not extend down
as low as the previous column of O's. We call that a rising bottom.
It signifies that supply is becoming less a factor in driving
the stock. On the other side of the coin, demand is getting stronger
as the last column of X's exceeds the previous column of X's
giving a double top buy signal. The rising bottom shows us that supply is getting weaker providing added guidance when evaluating the supply-demand relationship of the underlying stock. |
 |
The Bearish Signal
| Demand in this case is becoming weaker as
the last column of X's fails to reach the previous level. Selling
pressure however is increasing as evidenced by the lower column
of O's. These clues simply suggest demand is losing strength
and supply is gaining strength. |
 |
The Bullish and Bearish Signals here are part of Double Top/Double
Bottom patterns but when analyzing charts with all patterns types
recognizing a series of higher bottoms and tops or lower tops
and bottoms is crucial in making the right trade or investment
decision.
So far we have discussed the
Double Bottom and Double Top. All other patterns that we will
cover are expansions of this basic pattern set. By now, you can see
how simple this method is to grasp.
|