|
| Welcome: |
|
| Lesson 4: |
Part 2. Continued |
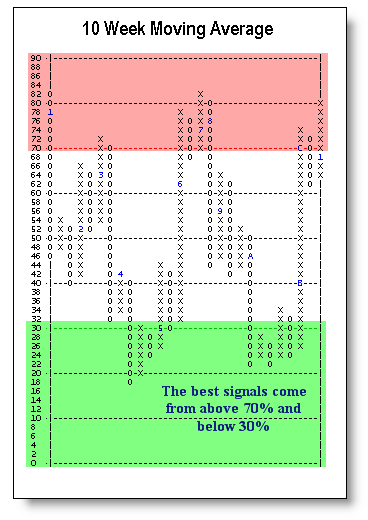
10
Week Moving Average
Also known
as the Percent of 10.
One
of our main short term indicators. As the name implies, this
is simply the percent of stocks on the NYSE that are above their
ten week moving averages. We also have a 10 Week for the OTC.
Buy signals occur when a column of O's falls at or below 30% and
then reverses to a column of X's.
Buy signals can also occur when a column of X's exceeds a previous
column of X's.
Sell signals occur when the index goes above 70% and then reverses
down below 70% or when a column of O's exceeds a previous column
of O's.
Being aware of the short term picture is important because often it will spill over into the long term picture. |
|
We use this short term indicator
with the High-Low index and we like to see them moving in concert
with one another.
The 10 Week moves a lot quicker
than the NYSE BP, the OTC or the Optionable BP because it is
a short term indicator. This index is of great benefit when you
are planning your trade. Investors should never use the 10 Week
Moving Average Index as their sole indicator in determining whether to
make new stock commitments. However, traders can effectively use it as a market timing indicator for short term trades. If the main trend in the market is up as dictated by the NYSE BP and the 10 Week is on a buy
signal, then you are in a market that is bull configured both
short and long term.
|
 |
High
Low Index
One
of the short term indicators, we use this in conjunction with
the Percent of 10.
This index is calculated by taking the number of new highs and
dividing by the number of new highs plus new lows. We keep this
calculation on a ten day moving average and then plot it on a
point and figure chart.
Buy signals come when the index falls to or below 30% and then
reverses up, or a column of X's exceeds a previous column of
X's.
Sell signals come when the index goes above 70% and then reverses
down below 70% or a column of O's exceeds a previous column of
O's, |
|
The chart is set just like a bullish
percent chart going from 0 to 100%. The two critical levels are
30 and 70%. Sell signals come from reversals above to below 70%.
Buy and sell signals can also come by exceeding a previous top
or bottom respectively. Reversals from above 70 percent suggest
that there is a trend change from more stocks making new highs
to more stocks making new lows.
The percent of 10 and the High
Low typically go in tandem but not always. Sometimes one lags
the other. Nothing is ever exact in the markets. These two indicators
are our main short term guides.
|
 |
More on the NYSE High Low Index
Below is a table showing
times when the NYSE High Low Index hit 10% and the subsequent
reversal up. As you can see, reversals up from below the 10%
level have been very good signs to re-enter the market with new
positions as this typically only occurs in very washed out markets.
| Date |
Moved
Below 10% |
Dow
Reading |
Low
Reading |
Dow
Reading |
Upside
Reversal |
Dow
Reading |
| Mar 1980 |
3-6-80 |
828.07 |
0.9% |
800.94 |
4-10-80 |
791.47 |
| Sep
1981 |
8-31-81 |
881.46 |
2.0% |
849.98 |
10-7-81 |
868.72 |
| Jun 1982 |
6-7-82 |
804.03 |
5.5% |
795.57 |
6-24-82 |
810.41 |
| Feb
1984 |
2-17-84 |
1148.87 |
7.5% |
1134.21 |
2-28-84 |
1157.14 |
| May 1984 |
2-17-84 |
1101.24 |
5.3% |
1124.35 |
6-11-84 |
1115.61 |
| Jul
1984 |
7-18-84 |
1111.64 |
5.5% |
1096.95 |
8-2-84 |
1166.08 |
| Oct 1987 |
10-20-87 |
1841.01 |
0.7% |
1938.33 |
1-4-88 |
2015.25 |
| Jan
1990 |
1-31-90 |
2590.54 |
8.9% |
2590.54 |
2-7-90 |
2640.09 |
| May 1990 |
5-2-90 |
2689.64 |
9.7% |
2689.64 |
5-7-90 |
2721.62 |
| Aug
1990 |
8-15-90 |
2748.27 |
3.4% |
2613.37 |
9-18-90 |
2571.29 |
| Nov 1994 |
11-23-94 |
3674.63 |
5.4% |
3746.29 |
12-21-94 |
3801.80 |
| Aug
1998 |
8-31-98 |
7539.07 |
4.2% |
7615.54 |
9-23-98 |
8154.41 |
| Oct
1999 |
10-21-99 |
10297.69 |
7.7% |
10302.13 |
10-29-99 |
10731.76 |
| July
2002 |
7-24-02 |
8191.29 |
7.5% |
8264.39 |
8-05-02 |
8043.63 |
|