|
Sector analysis is one of the
most important yet least analyzed parts of the market. We place
tremendous emphasis on sector rotation in our daily work. Probably
80 percent of the risk in a stock is the market and sector. Stock prices
do not move without rhyme or reason. These moves tend to be orchestrated.
A good analogy would be the picture
of wildebeest romping across the African plains, moving in unison
first in one direction and then another, but the majority go
together. Sectors operate the same way. Wall Street tends to
follow the herd. First one analyst raises the earnings expectation,
then the rest follow and before you know it, the sector is in
play.
As the sector moves up, other
institutions see the move and climb on board. Eventually the
mainstream financial periodicals catch wind of a major move underway
and begin to write articles about how the industry has made a
turnaround and should have clear sailing ahead. This draws investors
in just in time to catch the top. By the time the articles appear
in magazines about how great the industry is, almost everyone
is in that wants to be in. The last group is the unsuspecting
public, who use newspapers and magazines as their primary source
of stock market research.
Remember that prices move as
a direct result of supply-and-demand imbalances. If there are
no more buyers left to cast their vote, supply by definition
must take the upper hand. The sector then begins to lose sponsorship,
and the whole process begins again only in reverse this time.
|
Watch magazine covers carefully.
The next time you are in the airport look at the magazine rack
and see if you can find a widely read magazine that makes a major
statement on its cover about some sector of the market - something
like "The Banking Industry Is Dead". If you find one,
buy the magazine and keep it. Normally, the trend in that sector
will continue to move for a couple of months in the direction
the cover describes. Give that sector 8 months, and you will
find its behavior is the exact opposite of that suggested on
the magazine cover. The reason for this is that the cover stirs
Mr. Jones and Ms. Smith into action and while all the Jones' and
Smiths are busy reacting, the sector moves in the forecasted
direction. Once these investors are in and the door slams behind
them, there is no more buying or selling pressure (whichever
the cover suggests) left to sponsor the sector. The forces of
supply and demand begin to change, and the sector takes
the opposite track.
You must remember, to be successful
in the stock market you must look ahead: What is happening in
the market today has already been discounted many months ago.
When evaluating sectors you must be a contrarian. You must find
the courage to buy stocks in sectors that are out of favor. You
must avoid the crowd, go the opposite direction. This is extremely
difficult as it goes against human nature.
In Lesson 4 you saw a Point & Figure chart of the
S&P 500 demonstrating that after eight years, the S&P 500 is essentially at the
same level. Buying and holding the broad market has been akin to getting on a roller
coaster at one platform and getting off on that exact same platform. That's okay if
you're on the ride for a thrill but not okay if you are looking to make investment returns.
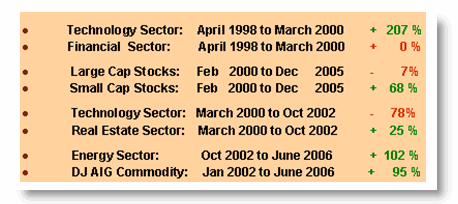
if you look under the hood though during this period and you'll see that there was a tremendous
amount of sector rotation happening. Here is an example of some of the themes from 1998
to 2006.
|