| Welcome: |
|
| Lesson 4: |
Part 1. Continued |
Attributes
of a Bullish Percent Chart:
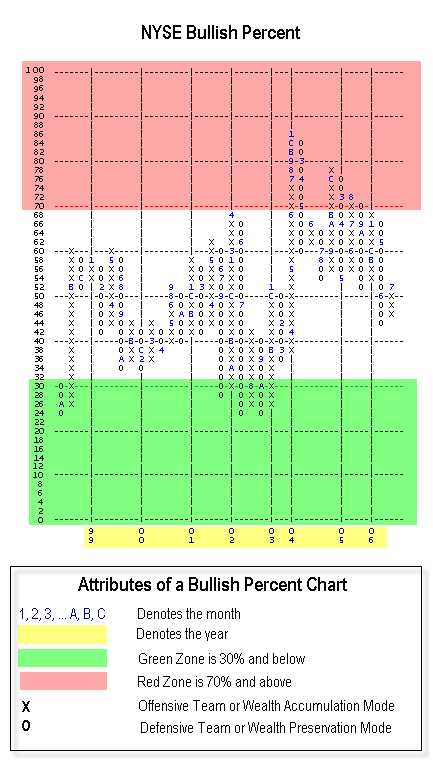
Many of the attributes you learned about for an individual equity chart also apply to the Bullish Percent.
For instance, the letters or numbers in the columns denote the months of the year. The years are divided
by a vertical line. Columns of X's and O's alternate and there are always at least three X's or three
O's in a column. It is important to observe that time spent in a column of X's or O's is generally
months and not weeks. The bullish percent chart will change columns using the same flow chart method
as a stock. It is essential that you know how this index works so let's go over how the index rises
and falls.
Example:
|
Let's say there are
100 stocks trading on the NYSE. Over the next week 12 stocks
experience a new buy signal and 10 stocks experience new sell
signals. The net result of the action for the week is two new
buy signals or 2 percent more stocks are on buy signals. Remember
that each box on the chart represents 2 percent, so a 2 percent
net change in new buy signals allows the chart to rise one box.
The only way to switch from one
column to the next is through a three-box reversal. It would
take a sum total of 6 percent net buy or sell signals to cause
a reversal. Remember the box sizes, in this case the box size
is 2 percent and therefore a three box reversal is 6 percent, in either
direction.
Reversing from one column to
the next is tantamount to losing or gaining possession of the
ball.
We use the football analogy here a lot because it helps visualize
how the NYSE BP works. The "playing field" runs from
0 to 100 percent, kind of like a 100 yard football field. Where
you are on that field determines your "field" position. The column you are in tells you if you have the footbal and the field position tells you how much room you have to run.
|
|

|
There are two things we try to ascertain with this chart:
1 - Who has the ball?
2 - What is the field position?
The higher the index climbs,
the more overbought it becomes. The lower it drops, the more
oversold it gets. When the index is rising in a column of X's,
we say you have possession of the football. When you have possession,
you must run offensive plays. This is your time to attempt to score
against your opponent, the stock market. When the index is declining
in a column of O's, we say the market has the ball and your job
is to try to keep it from scoring against you.
If you colored
the chart above the 70 percent level red and the area below 30
percent level green, these would represent the two extremes much
like the end zones of a football field.
When you are in the Green Zone, below 30% and in a column of X's you have a lot of room to run the ball.
When you are in the Red Zone and in a column of O's you have a lot of territory to lose the ball.
It isn't often the index moves below 30% or above 70%.
Thinking about this concept in terms
of supply and demand, when the NYSE Bullish Percent goes near/below
30% the availability of supply to continue to push the market
lower is severely limited. When the NYSE BP goes near/above the
70% level, the availability of demand to continue to push the
market higher is severely limited.
We've talked a lot about using
the NYSE Bullish Percent as a way to assess risk in the market.
Here are just some of the different ways one can play offense
(wealth accumulation) and defense (wealth preservation). It is important everyone creates their
own playbook.
| Sample Offensive Playbook | Sample Defensive Playbook |
- Increase equity exposure by buying stocks, funds, or ETFs
- Buy calls
- Focus on strong relative strength sectors
- Allow for more liberal stop loss points
- Positive relative strength stocks, funds or ETFs should be the focus
|
- Come off margin
- Reduce equity exposure
- Buy protective puts
- Sell laggard, weak relative strength holdings
- Tighten up stop loss points
- Inverse funds can be considered to reduce equity exposure.
- Short positions can be taken in weak relative strength stocks
|
|