|
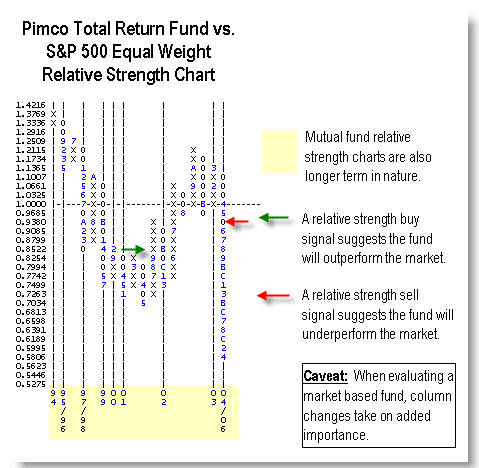
The mutual fund area of Dorsey, Wright & Associates is extensive. Both market and peer relative strength charts are
maintained for each mutual fund in our system. The relative strength calculation for mutual funds is the same as
calculating relative strength for equities. Simply stated, the relative strength calculation is the NAV of the
mutual fund each day divided by the S&P 500 Equal Weighted Index (SPXEWI). This number is then multiplied by 100 and
plotted on a relative strength chart. Similar to a stock, each mutual fund has three charts associated with it - a
price or trend chart, a market relative strength chart, and a peer relative strength chart. When the relative
strength chart gives a buy signal (a column of X's exceeding a previous column of X's) we would expect that fund to
outperform the market. When the relative strength chart gives a sell signal (a column of O's exceeding a previous
column of O's), we would expect that fund to underperform the market. One caveat in the interpretation of a mutual
fund RS chart is one will want to take into account the similarity of the fund to the baseline index. For instance,
most of the market based mutual funds, such as large cap funds, value funds, etc., move slow enough against the S&P
Equal Weighted Index that you will want to place the most emphasis on the column of the relative strength chart.
Other funds, such as international funds, fixed income funds, sector funds, etc. can be evaluated by looking both at
the signal and the column.
|
 |