|
Market Relative Strength
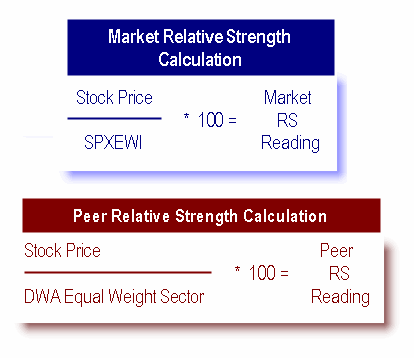
The Relative Strength versus the market calculation is simple. It is the price
of the Stock divided by the S&P Equal Dollar Weighted Index. This result is multiplied
by 100. The S&P Equal Dollar Weighted Index (SPXEWI) is the index we choose to evaluate
stocks against. We have chosen this index over the Dow Jones and the Cap Weighted S&P
because it is equal dollar weighted. As you learn more about Dorsey Wright and this
methodology you will realize that most of our indicators are created on an equal weighted
basis. We want to get a clear picture of the broad market, not just a handful of the
largest stocks in an index.
This calculation is performed each night and the result is plotted on a point and
figure chart. RS charts use a three-box reversal method just like the trend charts. The
difference here is that you do not have a high and low value. You still follow the flow
chart but there is only one price to use. Another difference between a trend chart and RS
chart is the scale used. We have created a scale for RS charts that requires an equal
performance in order to cause a reversal, regardless of its price. When evaluating a RS
chart the calculation values and the scale are not important. It is the chart formation
of the RS chart that matters, in fact, to determine the RS of a stock you do not even
need to see the scale!
Peer Relative Strength
In addition to the Relative Strength versus the S&P 500 Equal Weighted Index (Market) we
also create relative strength versus a stock's peer group. Dorsey Wright has created Equal
Dollar weighted indices on each of its 40 broad sectors and these are the indices we use to
create a RS chart for a stock versus its peers. Peer RS charts are updated in the same
manner as the Relative strength versus the SPXEWI (Market) charts.
|
|