First Flow Chart Question: "Continue Current Column with X or O?"
Whichever column the
chart is in, you will remain in that column as long as the stock
continues moving in that direction. If the chart is currently
in a column of X's your first question is, "Did the stock
rise one full box or more on the chart?". If it did move
one full box, then you record that move by adding another X to
the column. You are now done updating that chart for the day.
As mentioned above when charting, you are concerned with the price which causes
the chart to continue in the current column. In other words we are establishing
an action point. If the chart is in a column of X's, you are looking at the high
price of the day, rounding down to the next whole number. If the chart is in a
column of O's, you are looking at the low price of the day, rounding up to the
next whole number.
| For
example, a stock has a high of 28.875. For charting we would
use this at 28 |
|
29
28 X <-28.875 is not high enough
27 X  to close the 29 box.
26 X
25 X
|
| When
looking at the low, you go up to the next whole number. Using
the same example, a stock has a low of 28.875. You would read
this as a low of 29. |
|
32 O
31 O
30 O
29 O <-28.875 is not low enough
28    to close the 28 box.
|
For the smaller
box sizes you still round to the "whole" numbers
in the box.
| For
example, in the .50 box size if a stock trades to 10.63 you would
mark up to the 10.50 box not the 11.00 box. |
|
11.00
10.50 X <-10.63 is not high enough
10.00 X   to mark up to the
9.50  X   11.00 box
9.00  X
|
| With
the .25 box size if a stock trades to 4.73 for instance, you
would mark the boxes to 4.50 not 4.75. |
|
5.00
4.75
4.50 X <-4.73 is not high enough
4.25 X   to mark up to the
4.00 X   4.75 box.
|
Second Flow Chart Question: "Does Stock Reverse Columns on Chart?"
If the answer to the first flow chart question was "no", then we must determine whether
the chart reverses direction thus changing columns. We use a three box reversal method to
determine a reversal.
Three
Box Reversal Method:
The price action of a stock is marked by two different columns,
by X's for the price moving up and O's for the price moving down.
In other words, X's are for demand and O's are for supply. To
move from one column to the next, from X's to O's or vice versa,
Point and Figure charts require a three box reversal. The stock
must be able to move three boxes before it can change columns.
If a stock is in X's at $25 then it must fall 3 boxes to reverse into
a column of O's. This would be $3 since the scale of the chart at $25
is $1 per box and it must reverse by three.
Reversal Requirements:
Use this as
a guide. |
0.00
5.00
20.00
100.00
200.00 |
to
to
to
to
and |
5.00
20.00
100.00
200.00
above |
0.75 pts.
1.50 pts.
3.00 pts.
6.00 pts.
12.0 pts. |
Examples:
Here are examples of
the three box reversals for the different box sizes.
|
0.00 to 5.00 chart (0.25 box)
As shown in this example, the price had to move down or up a
total of 0.75 points to complete the three box reversal.

The reversal up, a move from 3.50 to 4.25, is a total of .75 points.
A move down from 4.50 to 3.75, is a total of .75 points. As per
the guide above that is the amount needed for the reversals.
|

|
5.00 to 20.00 chart (0.50 box)
As shown in this example, the price needed to move 1.50 points down to make a full reversal.

The reversal up, a move from 16 to 17.50, is a total of 1.50 points.
The reversal down, a move from 18 to 16.50, is a total of 1.50 points.
|
20.00 to 100.00 chart (1.0 box)
As shown in this example, the stock needed to move 3.00 down
to make a full reversal. See how on this chart a larger point
move is needed than the previous two.
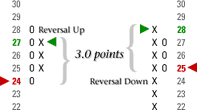
The reversal up, a move from 24 to 27, is a total of 3 points.
The reversal down, a move from 28 to 25, is a total of 3 points.
|
102.00 - 200 .00 chart (2.0 box)
As shown in this example, the stock needed to move 6.00 points down to make a full reversal.
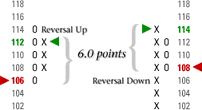
The reversal up, a move from 106 to 112, is a total of 6 points.
The reversal down, a move from 114 to 108, is a total of 6 points.
|
If the stock does not meet the criteria to reverse (described above)
then there is not action on the chart for that day. Unlike a bar chart,
a Point and Figure chart won't necessarily make a movement everyday.
If the price action of the trading day does not continue the
chart in its current direction (flow chart question 1) or change columns (flow chart question 2), no mark is made on the chart.
For
example, on the 1 box chart:
Let's say a stock trades a high of 32.50 and a low of 29.875
and the column of X's are at the 32 level.
We'll go into
more detail about this in a little bit. |
|
33
32 X <-32.50 Isn't high enough
31 X    to add an X.
30 X
29 X <-29.875 isn't low enough
        to add O's
|